NFC South 2026 Season Preview – A Data-Driven Look
The NFC South is wide open for a different reason than the NFC North: no team projects to finish above .500. Carolina, Atlanta, and Tampa Bay are all forecast at 8–9, with New Orleans only one game behind. Division results may decide everything.
This preview uses adjusted offense, defense, and power ratings from 2021 through 2025 to evaluate a division with no clear favorite.
Division Overview (2021–2025)
Tampa Bay owns the division’s best five-year profile but slipped on both sides of the ball in 2025. Carolina made a large defensive improvement, Atlanta remained close to average overall, and New Orleans continued to struggle offensively.
Defensive Trends
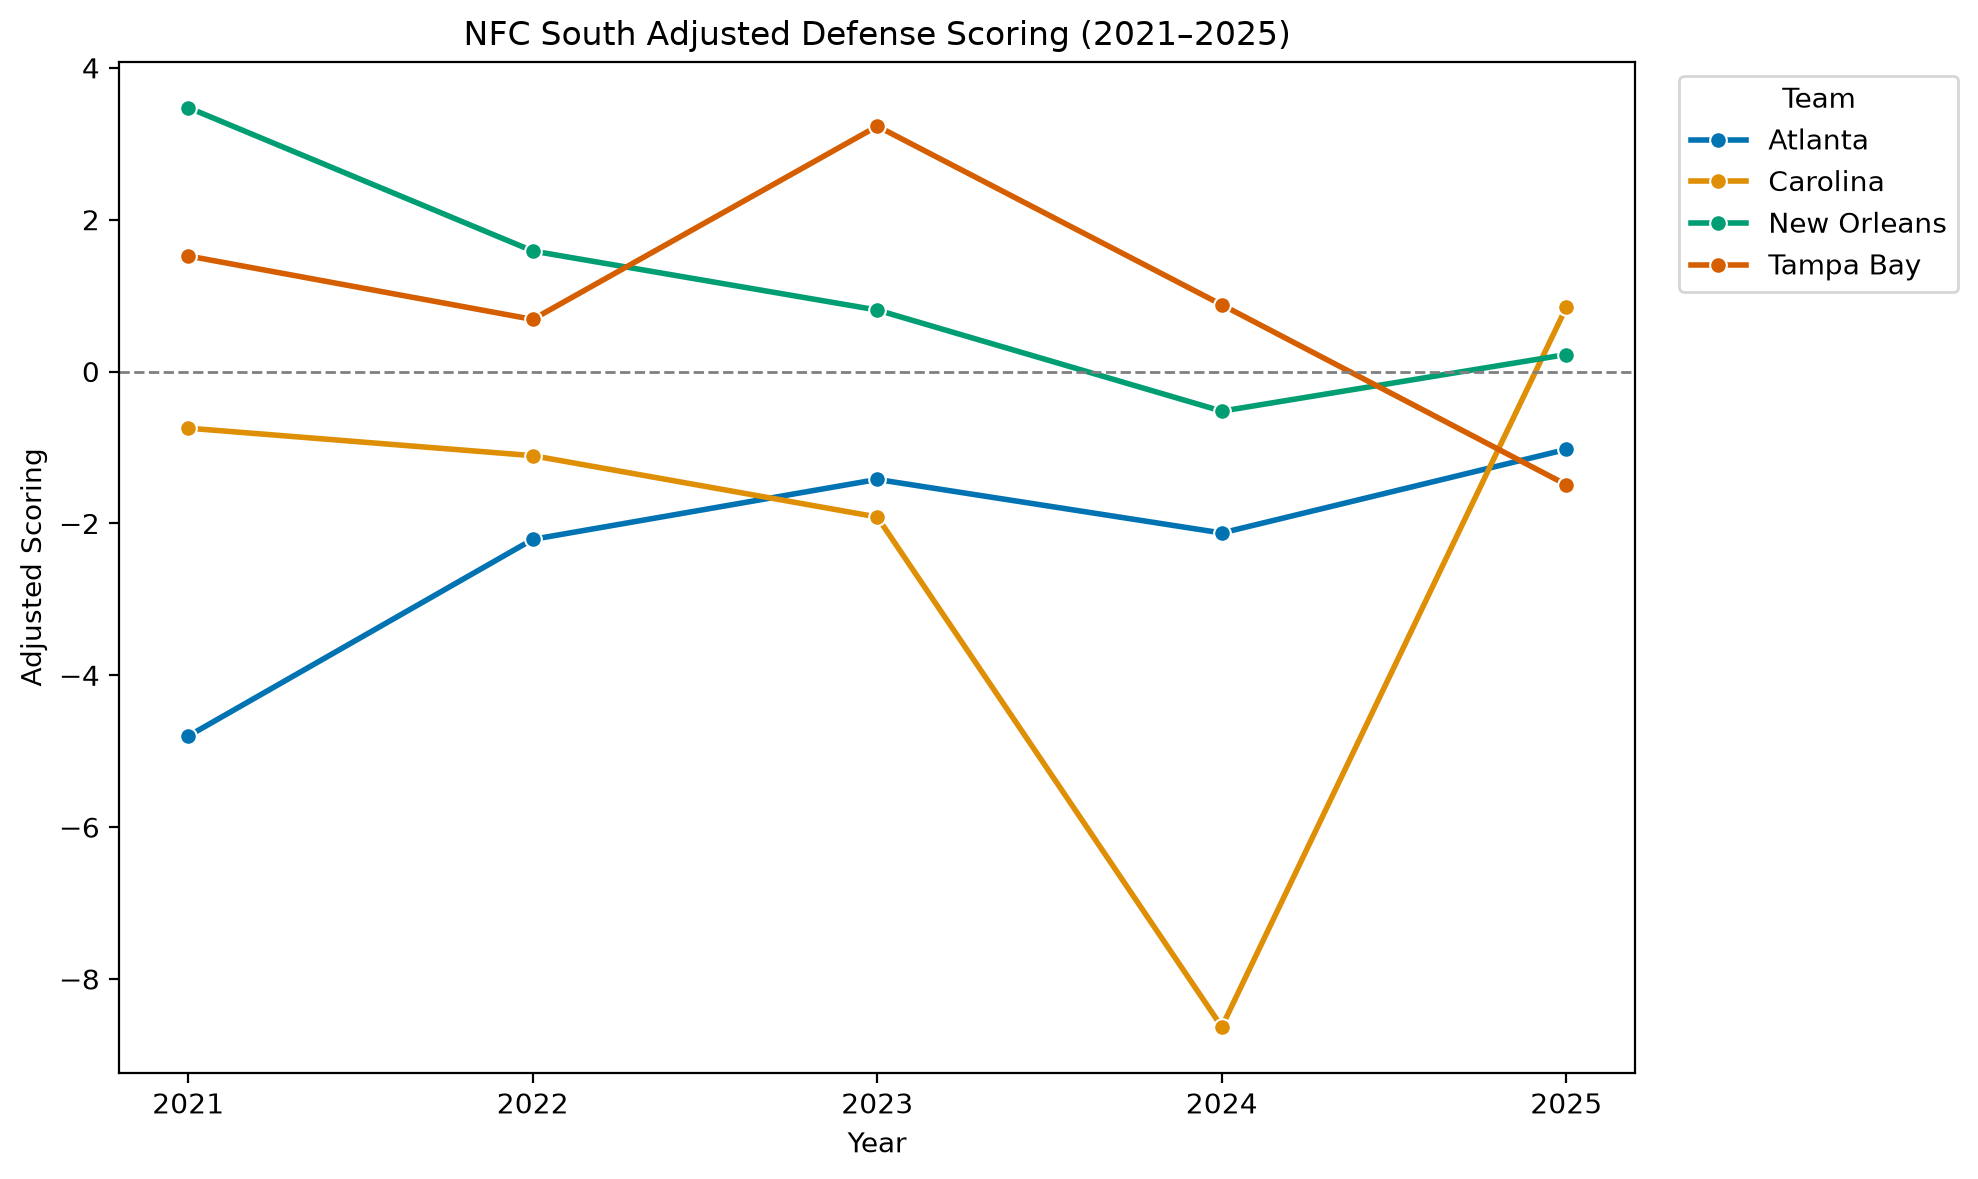
Carolina led the division at +0.846 in 2025 after finishing at -8.631 a year earlier. New Orleans was also slightly positive at +0.224. Atlanta (-1.025) and Tampa Bay (-1.491) finished below average.
Offensive Trends
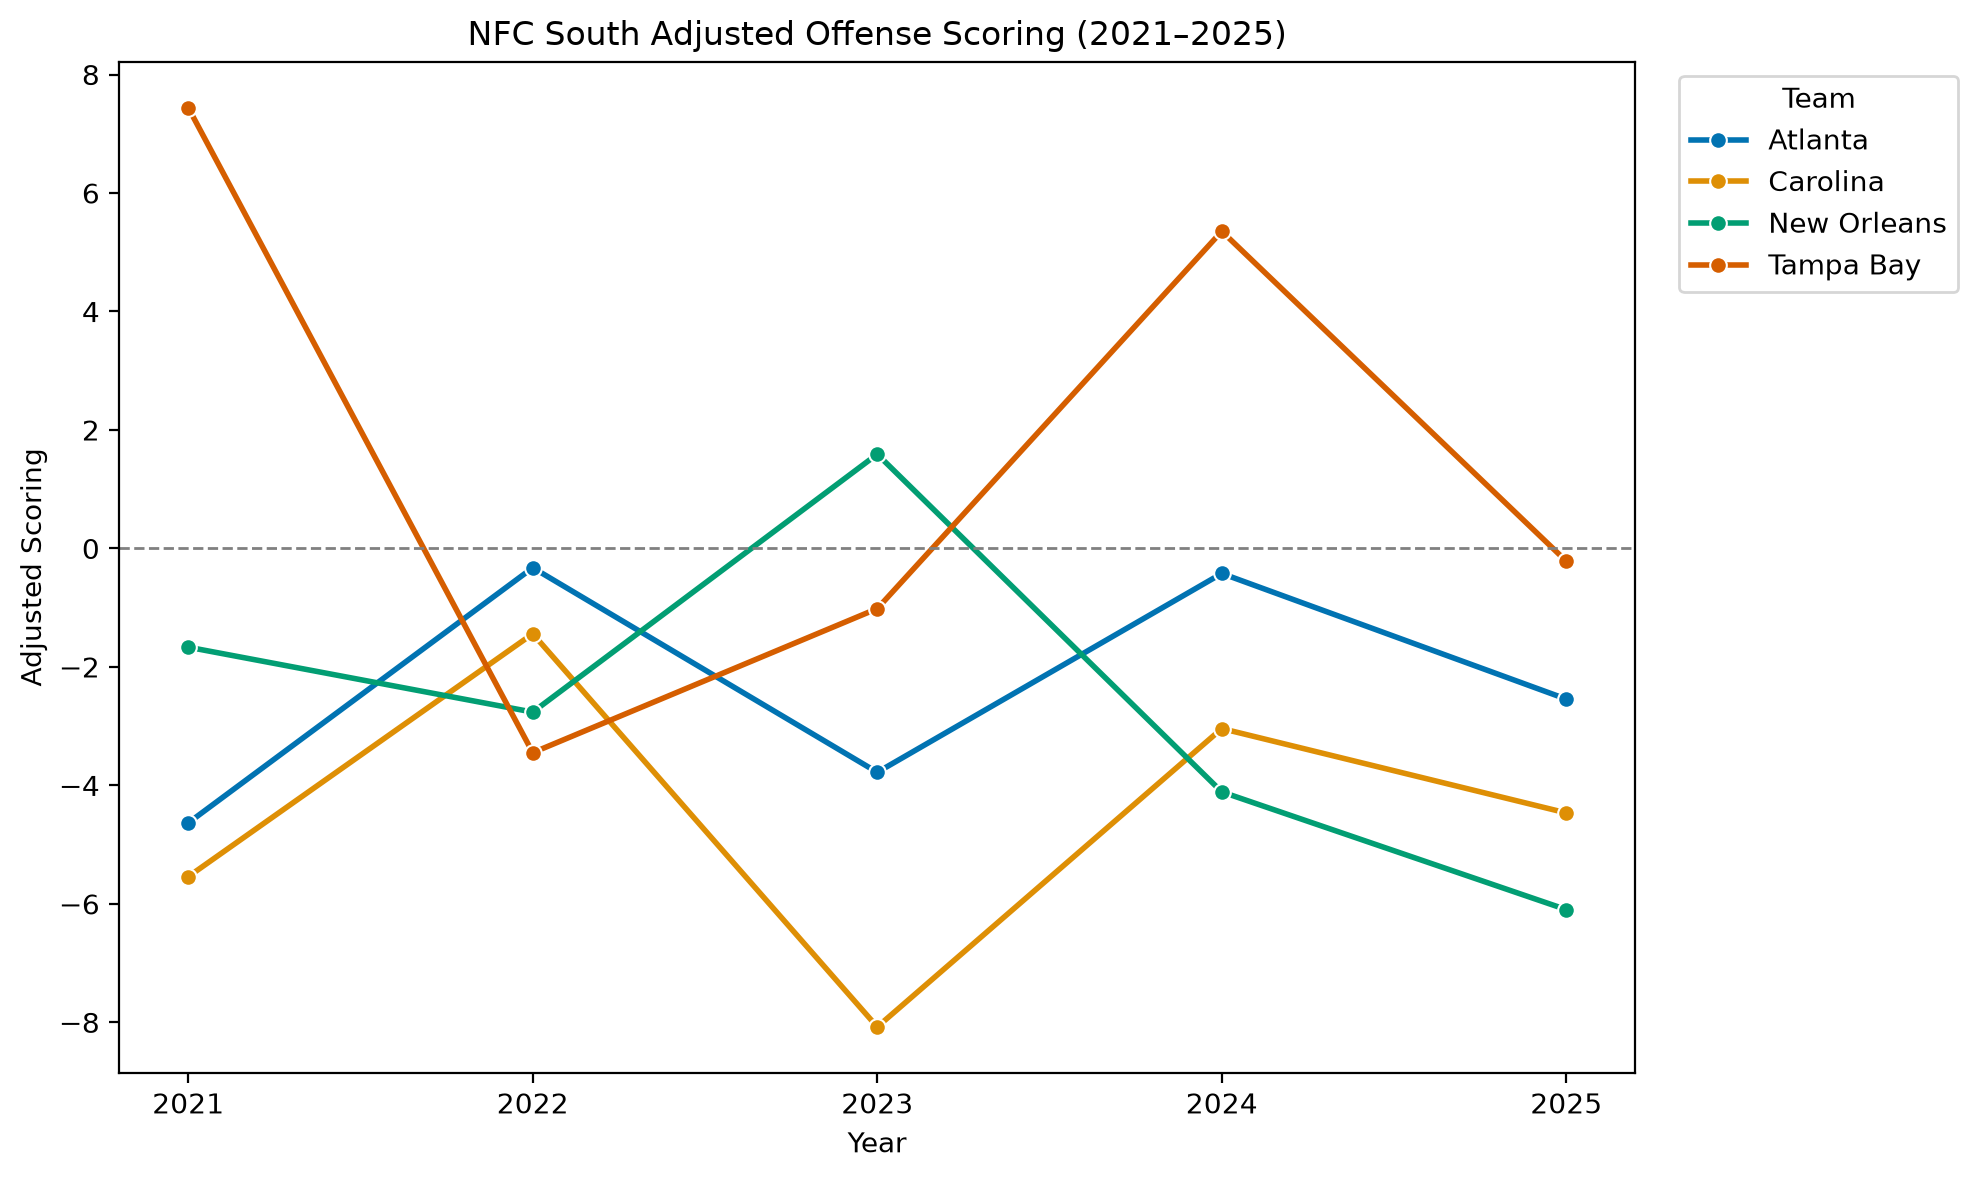
Every NFC South offense finished below average in 2025. Tampa Bay was closest at -0.215, followed by Atlanta (-2.543), Carolina (-4.465), and New Orleans (-6.097).
Power Ratings
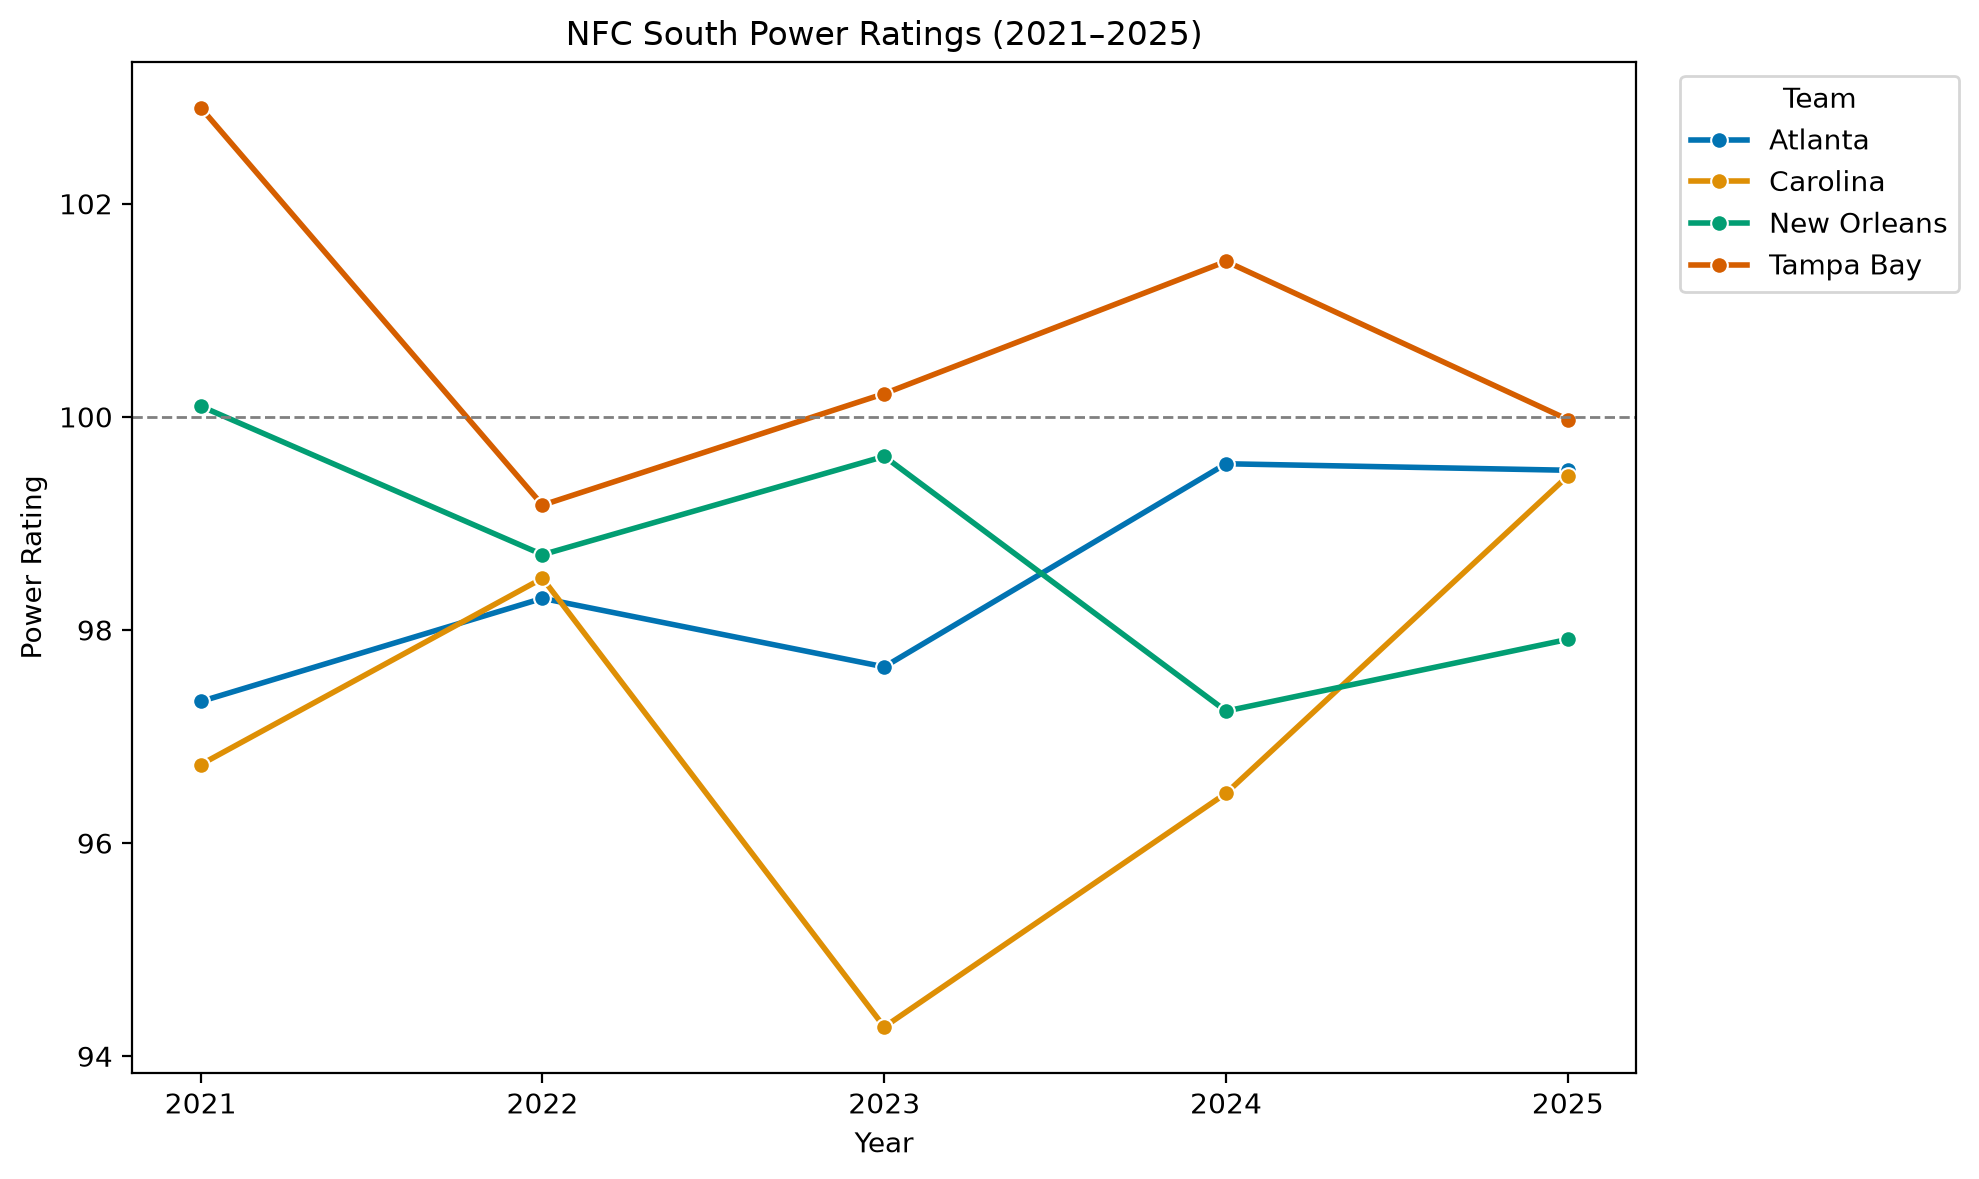
Tampa Bay finished closest to average at 99.975. Atlanta (99.499) and Carolina (99.445) were nearly identical, while New Orleans trailed at 97.912.
Team-by-Team Data Analysis
Carolina Panthers
Five-Year Offensive Trend: -5.541 → -1.440 → -8.077 → -3.040 → -4.465 Five-Year Defensive Trend: -0.746 → -1.108 → -1.916 → -8.631 → +0.846 2025 Rating: 99.445
Carolina’s offense remains a major weakness, but the defense’s dramatic rebound brought the overall rating close to league average. A projected 5–1 division record supplies the tiebreaking edge in a three-way tie.
Data Outlook for 2026: Projected record: 8–9 (division winner)
Atlanta Falcons
Five-Year Offensive Trend: -4.633 → -0.325 → -3.779 → -0.422 → -2.543 Five-Year Defensive Trend: -4.801 → -2.210 → -1.421 → -2.126 → -1.025 2025 Rating: 99.499
Atlanta has not posted a positive rating on either side of the ball during this five-year span. The Falcons remain competitive because neither unit was far below average in 2025, but they still lack a defining strength.
Data Outlook for 2026: Projected record: 8–9
Tampa Bay Buccaneers
Five-Year Offensive Trend: +7.441 → -3.448 → -1.016 → +5.354 → -0.215 Five-Year Defensive Trend: +1.522 → +0.686 → +3.231 → +0.879 → -1.491 2025 Rating: 99.975
Tampa Bay has the division’s best five-year averages and highest current power rating, but its projected 2–4 division record pushes it behind Carolina and Atlanta in the standings.
Data Outlook for 2026: Projected record: 8–9
New Orleans Saints
Five-Year Offensive Trend: -1.667 → -2.763 → +1.591 → -4.110 → -6.097 Five-Year Defensive Trend: +3.476 → +1.587 → +0.810 → -0.522 → +0.224 2025 Rating: 97.912
New Orleans still has a positive five-year defensive average, but the offense has fallen sharply in consecutive seasons. Even so, the Saints project only one game behind the three co-leaders.
Data Outlook for 2026: Projected record: 7–10
Projected NFC South Standings (2026)
| Team | 2021–25 Offense Avg. | 2021–25 Defense Avg. | 2025 Rating | 2026 Projection |
|---|---|---|---|---|
| Carolina Panthers | -4.513 | -2.311 | 99.445 | 8–9 (Division) |
| Atlanta Falcons | -2.340 | -2.317 | 99.499 | 8–9 |
| Tampa Bay Buccaneers | +1.623 | +0.965 | 99.975 | 8–9 |
| New Orleans Saints | -2.609 | +1.115 | 97.912 | 7–10 |
Conclusion
Tampa Bay has the strongest ratings case, but the schedule projection favors Carolina inside the division. Atlanta is close enough to win it as well, and New Orleans is only one projected victory behind. This race may remain unsettled until the final week.